sharing... interesting read
Data from 2006 to 2011
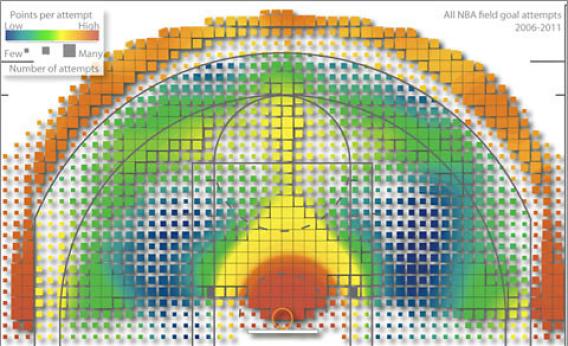
A color-coded map of all shots taken in the NBA from 2006-2011. The areas on the floor that yielded the most points per shot appear red; those that yielded the fewest points per shot appear blue.
summary - best shooter- Range and Spread
1.) “Spread,” which is simply a count of the unique shooting cells in which a player has
attempted at least one field goal. The raw result is a number between 0 and 1,284 and summarizes the spatial diversity of a player’s shooting attempts. By dividing this count by 1,284 and multiplying by 100, we generated Spread%, which indicates the percentage of the scoring area in which a player has attempted at least one field goal.
Spread describes the overall size of a player’s shooting territory. League leaders in FG% generally have a small Spread value since they tend to only shoot near the basket. For example, since centers generally thrive in limited areas near the hoop they tend to have lower Spread values than shooting guards. Kobe Bryant has the highest spread value in the NBA (table 1); Bryant’s value of 1,071 indicates he has attempted field goals in 1,071 of the 1,284 shooting cells or 83.4% of the scoring area. In contrast, Dwight Howard has attempted field goals in only 23.8% of the shooting cells. Although Spread% favors players who simply shoot frequently, it also reveals that some
players like Dwight Howard who do shoot a lot, only do so in limited court spaces
2.) Range - These Spread visualizations reveal a player’s basic shooting tendencies, but tell us nothing about potency. Shooting skill requires more than just attempts; the best shooters in the league are able to make baskets at effective rates from many court locations. To describe the spatial potency of players we created a metric called “Range,” which is a count of the number of unique shooting cells in which a player averages at least 1 point per attempt (PPA). PPA varies considerably around the court. As anyone who has ever shot a basketball knows, the probability
of a shot attempt resulting in a made basket is spatially dependent; some shots are easier than others, and some players are unable to shot effectively from most court locations. Range accounts for spatial influences on shooting effectiveness. It is essentially a count of the number of shooting cells in which a player averages more than 1 PPA; we chose PPA over FG% because it inherently accounts for the differences between 2-point and 3-point field goal attempts.
comparison
dirk & kobe
nash and ray
source:
http://www.slate.com/blogs/browbeat/..._to_shoot.html
http://www.sloansportsconference.com...Submission.pdf
p.s. - this is just on paper.
Results 1 to 4 of 4
-
03-07-2012, 12:54 PM #1
 (NBA) What Geography Can Teach Us About Basketball
Last edited by jiro; 03-07-2012 at 01:00 PM.
-
03-07-2012, 09:02 PM #2Banned User

- Join Date
- Jan 2012
- Gender

- Posts
- 4,273
 Re: (NBA) What Geography Can Teach Us About Basketball
pwede mag-seminar ta ani? hehehe.. kapoy man ug analyze diri.. hahaha
-
03-08-2012, 09:01 AM #3
 Re: (NBA) What Geography Can Teach Us About Basketball
red means where most of the shots get in, bigger dots means number of shots taken.
according his data, kobe is the best shooter overall. top1 sa spread, top 3 sa range.
nash and ray are the best effective shooters at any range.
dirk shoot effectively and favors the left side.
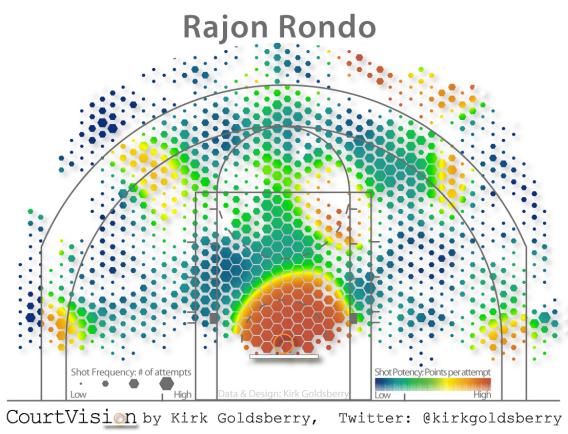
rondo can be effective at shooting 3's at the sides and upper left or right. most of his shots are under the ring.
also, according to the author, this data can be used to where best guard the players, type of defense to use againts any team.
-
03-09-2012, 01:07 PM #4Elite Member

- Join Date
- Oct 2008
- Posts
- 1,536
 Re: (NBA) What Geography Can Teach Us About Basketball
mura d i nig katong program gigamit sa statistician sa money ball nga salida...
Advertisement
Similar Threads |
|


 Reply With Quote
