


Peeps,
allow me to share my personal review on my previous gaming rig... had changed the mobo to ASRock Fatal1ty Z77 Professional already. This review is for the GPU...
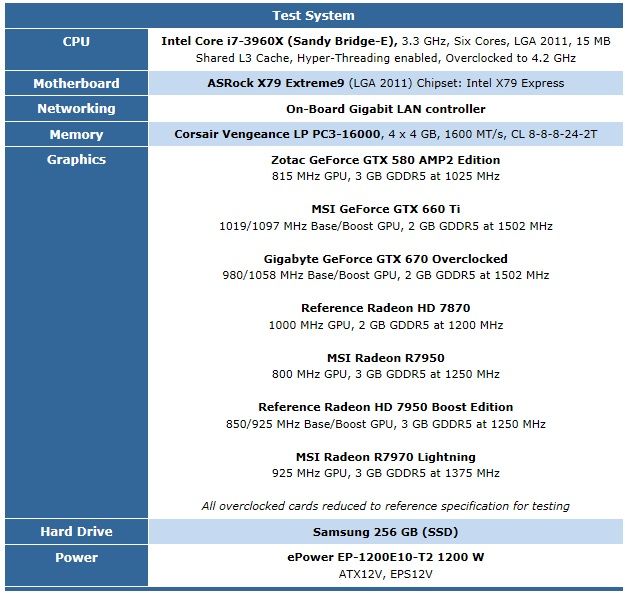
HW Set-up:
CPU: i3-2120 @ 3.3 GHz (all cores are active and HT enabled)
GPU: Inno3D GTX 660 Ti iChiLL 2GB Factory OC... GPU clock@ 1020 MHz (1098 MHz boost) & Memory frequency @ 6212 MHz.
Mem: Avexir Core Series DDR3 1333 2 x 4GB (8GB)
Mobo: ASRock H61DE/Sl
HDD: WD Caviar Blue 320GB SATA 2
PSU: Corsair TX 750W
Cooling System: Corsair H50
Monitor: Acer H274HL (27" LED backlit)
DVD: Pioneer
Broadband connection: 10 Mbps
Nvidia driver version: 306.97
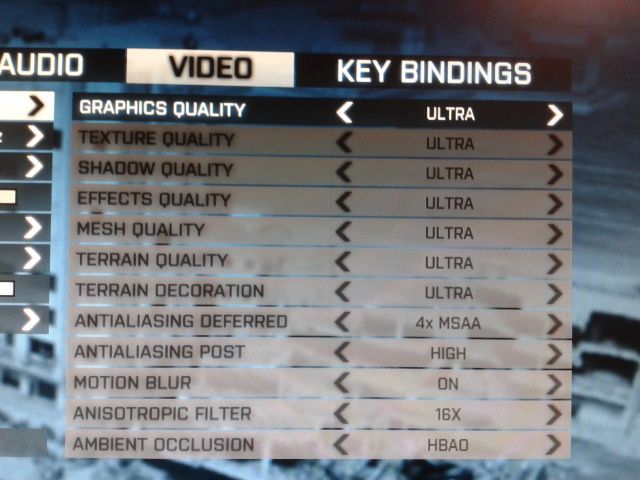
Games: BF3 Premium Edition
Settings: Ultra
No. of players: 64 max
Maps: Large... auto random selection during online game play
Resolution: 1920 x 1080p
Frame Capture Application: FRAPS ver 3.4.1
Capture time per test: 300 seconds
Number of test: 60x
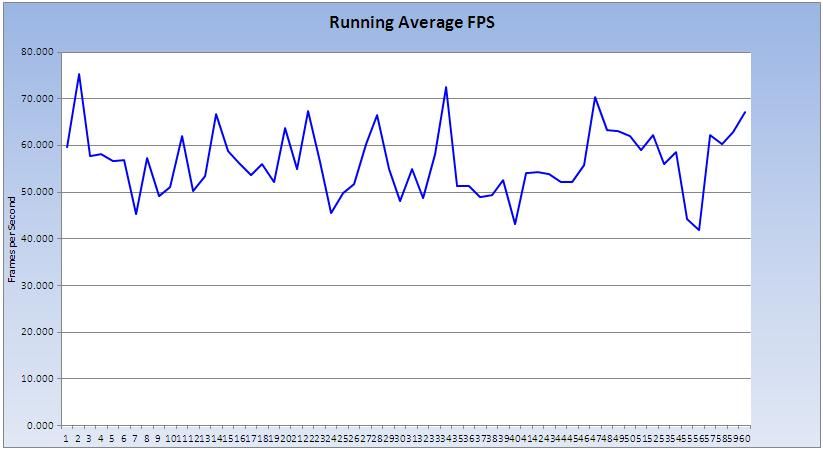
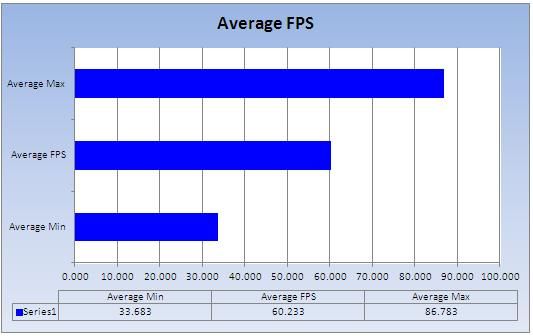
Here's for the running average FPS during the entire length of the testing... had just removed the Min and Max FPS data points for this chart.
Average FPS Chart...
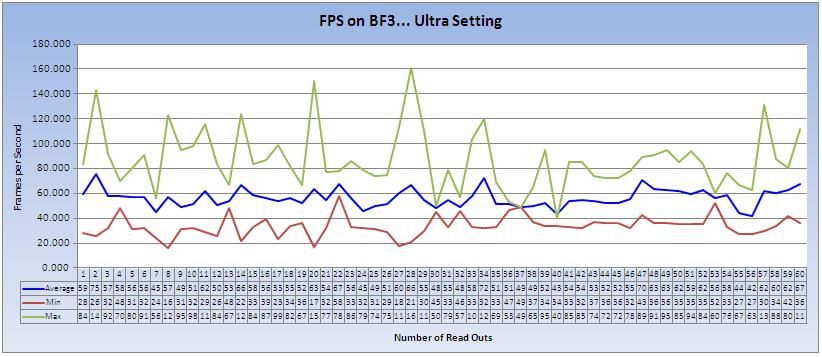
Min & Max Chart...
I had chosen to obtain the numbers from the actual online game play @ 64 players on large map so that the read outs will be from the actual gaming experience. For me, the frame per second (FPS) is acceptable. The minimum FPS that was obtained during the whole duration of the test was at 16 fps but, I can not distinguish or pinpoint where did it happen during the gaming time. The average FPS was running above 50 FPS. The actual gaming experience on BF3 at Ultra settings on 1920 x 1080p is good though.
I'll get another round of review for the ASRock Fatal1ty Z77 Professional mobo if there's a slight improvement on the actual game play. There's a big improvement in Heaven benchmark though... I'll upgrade to a slightly powerful CPU later. I'll show the results once this plan will be materialized.
By the way, this review is transparent, the min and max FPS were shown. Most of the online reviews doesn't show the min FPS. They just don't like to show it I guess since it can change the readers perception. They did not even explain their test methodology on how do they get those numbers. Dips are real in the game... Anyway, you've got this one as transparent as a glass.
Please share your review also... Salamat...
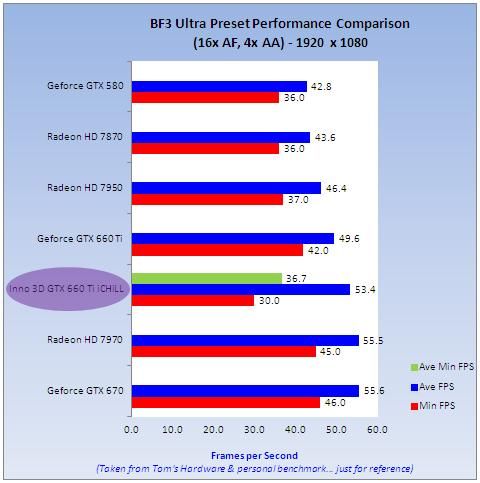
Additional lang ni na chart for quick reference... had added the result of my benchmark analysis. had removed all the spikes on my benchmark to normalize the data. cut off was set at 30 to 90 FPS. all uncontrolled factors that made those spikes were removed in the chart below. it's a normal thing to do in any eng'g analysis. the test/ benchmark methodology used is not the same though since we don't know how many data points did Tom's obtained during their testing. I'll get some data for apple-to-apple comparison after some time. Here's the link from Tom's Hardware review...
Benchmark Results: Battlefield 3 : GeForce GTX 660 Ti Review: Nvidia's Trickle-Down Keplernomics
By the way, the hardware used by Tom's during their benchmark was an enthusiast level... capture nako for your quick reference...
Results 1 to 10 of 135
-
11-22-2012, 10:21 PM #1C.I.A.


- Join Date
- Mar 2005
- Posts
- 10,898
 Inno3D GTX 660 Ti iChiLL Review from an Istoryan
Last edited by lloyd_joy; 11-26-2012 at 06:59 PM.
-
11-22-2012, 11:27 PM #2Elite Member

- Join Date
- Aug 2011
- Gender

- Posts
- 1,207
Re: Inno3D GTX 660 Ti iChiLL Review from an Istoryan
HALA noh!!! sa VC ra d aie ni gi daOG? LIKE ta vehhh hmmmm more enlightenment boss
 !
!
nice ni nga thread dah try pud uban games boss! subbed btw!
-
11-22-2012, 11:31 PM #3C.I.A.
- Join Date
- Mar 2005
- Posts
- 10,898
Re: Inno3D GTX 660 Ti iChiLL Review from an Istoryan
BF3 ra man ang bug-at nko na games dri bro. ang uban, wla'y challenge kay gaan sila kaayo. mao ra ni ang uban ai... Diablo 3, Stronghold 3 Gold, Stronghold Crusaders, Warcraft 3 ug Age of Empires 3 ra man ang mga games nko dri...
-
11-22-2012, 11:33 PM #4Elite Member
- Join Date
- Aug 2011
- Gender
- Posts
- 1,207
Re: Inno3D GTX 660 Ti iChiLL Review from an Istoryan
hahaha ok rana boss this proves nga average niya is 60 FPS which means no lag at all then online ni nga gameplay sa haha i3 pa jud KOYOSO! !
-
11-22-2012, 11:39 PM #5C.I.A.
- Join Date
- Mar 2005
- Posts
- 10,898
Re: Inno3D GTX 660 Ti iChiLL Review from an Istoryan
naa man gyud mga dips during gaming as what i showed on the chart, pero, dili ko maka notice ani. wala man gud ko maka suway sa mga higher GPUs in playing BF3 pud. wla ko'y ma compare-ran na high end...
-
11-22-2012, 11:41 PM #6Elite Member
- Join Date
- Aug 2011
- Gender
- Posts
- 1,207
Re: Inno3D GTX 660 Ti iChiLL Review from an Istoryan
so mo simang gamay? i mean while ga play ka mo lag siya? pilit2x graphics chuva?
-
11-22-2012, 11:56 PM #7C.I.A.
- Join Date
- Mar 2005
- Posts
- 10,898
Re: Inno3D GTX 660 Ti iChiLL Review from an Istoryan
dip or lag, the same man siguro ni... hehehe... dili ko suhito ani. ang sa mga mahalon na rig, mura'g 60 fps ang min frame rate nila. don't know kun tinuod ba gyud pud na number to ilahang gipang mention sa did2 sa mga uban na forums. igo ra man sulti wala man data gud nag gipakita... hehehe... pero, grabeh to sila'g set-up. high end man to ilaha... sakit2x gyud to'g price pud... kani akoa kay mid ra man lagi ni. it is very acceptable to my level of gaming... share lang ko kay daghan man nato dri sa istorya na in-ani ra ang level sa set-up... daghan pud ang nindot ug set up dri pud baya...
-
11-23-2012, 12:00 AM #8Elite Member
- Join Date
- Aug 2011
- Gender
- Posts
- 1,207
Re: Inno3D GTX 660 Ti iChiLL Review from an Istoryan
e try daw nah sa i5 boss kay i heard BF3 utilizes all 4 cores if im not mistaken, nalimot ko when ug asa ko ni na hear... since sa i3 hyperthread raman murag virtual cores..
pero tungod sa thread dri about VC nga atong nagamit i concluded nga mag 7750 nlng KO!!! hahaha nya spend much on procie! hahahahahaha kay sakit kaau sa heart kung mo palit ko ug tag 6k na VC nya after pila ka months mahimong 4k or worst 2k! hahahaha
-
11-23-2012, 12:06 AM #9C.I.A.
- Join Date
- Mar 2005
- Posts
- 10,898
Re: Inno3D GTX 660 Ti iChiLL Review from an Istoryan
mag upgrade ko to a higher CPU puhon ani nya bro. pero, unahon sa nko palit puhon ang 2nd Inno3d GTX 660 Ti... basin next month... check pa nko ang budget if it will permit me to purchase one... after lang nya ang CPU...
nindot unta mag try ug i5 pero, wla man ko'y mahuwaman dri man gud... ang duha ka LGA1155 nako dri kay dual cores ra man gihapon ni sila... Celeron G530 ug Pentium G840
-
11-23-2012, 12:12 AM #10Elite Member
- Join Date
- Aug 2011
- Gender
- Posts
- 1,207
Re: Inno3D GTX 660 Ti iChiLL Review from an Istoryan
aww i SMELL SLI! pero dako raman kaau ang iCHill sir.. masigo pa sa imong case? or for other rig ang ikaduha nga GTX 660 ti? Originally Posted by lloyd_joy


 Reply With Quote
 Advertisement
Similar Threads |
|
 Posting Permissions

|